
https://nginx-develop-nfsa2.govcms7.amazee.io/sites/default/files/2024-04/Singoring%201000x745.jpg


A graphical representation of a film‘s response to light. Also called the D-Log E curve or the HD curve. A curve plotted on a graph from two axes, exposure and density, used to describe the characteristics and performance of sensitive emulsions.
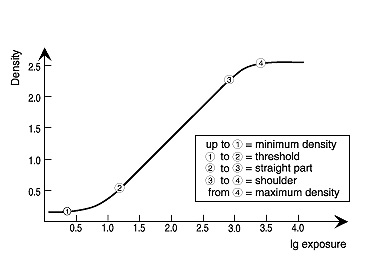
A characteristic curve is a graph of the relationship between the amount of exposure given a film and it’s corresponding density after processing.1
A typical film characteristic curve is made by plotting density produced, against the log of exposure given (Log E). The shape of the curve represents the tonal response of the film to a wide range of exposures and to one particular processing condition. As the slope of the curve decreases, the ability of the film to record the contrast between different exposures also decreases, and stops completely as the curve becomes horizontal.
 https://nginx-develop-nfsa2.govcms7.amazee.io/sites/default/files/uploads/2010/10/05/characteristiccurve.jpg
Three curves are plotted for colour film using data derived from densitometer measurements of the three colours, R,G,B.
The term toe refers to the portion between points 1 and 2 in the diagram. It begins at the threshold and continues to the straight-line portion. Density is variable and does not increase by a constant factor.
The term straight-line portion refers to the section of the curve between 2 and 3 on the diagram. In this portion density increases by a constant factor upon increases in exposure. There is a linear relationship between density and log-exposure (Log E).
This refers to the portion between 3 and 4 on the diagram. The shoulder is the reverse to the Toe. In this section, on increasing exposure the rate of density-increase gradually declines until point 4 is reached. This is called “Maximum Density”. Beyond this point exposure variability can not be recorded as density variability.
The sensitivity or speed inherent in a film can be derived from its characteristic curve.
Two measures are generally used to express photographic image contrast; gamma and average gradient. The former (writtený) stands for the slope of the straight-line portion of the characteristic curve, and the latter (written bar G) represents the slope of the straight-line portion between two particular points on the characteristic curve.
The least possible amount of blackening in the unexposed area of a film is called the minimum density. In the case of black and white film the minimum density is the sum of development fog density and base density.
1 Kodak
The National Film and Sound Archive of Australia acknowledges Australia’s Aboriginal and Torres Strait Islander peoples as the Traditional Custodians of the land on which we work and live and gives respect to their Elders both past and present.